
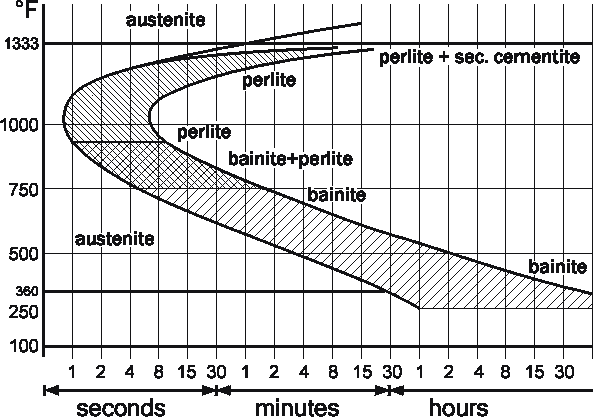
The time-temperature-transformation diagram displays the grain structures resulting from isothermal transformation.
The transformation-curves are influenced by the alloying elements, therefore it often cannot be transferred from one steel to the other. For most steels these curves are available in the literature.
At non-isothermial transformation, the periods before transformation vary.
Often diagrams for constant cooling rates are available as well, but the time-temperature-transformation diagram often gives sufficient information
what grain structures are to be expected after heat treatment. It also indicates
how fast cooling must take place to avoid the formation of perlite at elevated temperatures.
© 2005 G.v.Tardy